From Chaos to RCA: How Azure SRE Agent Investigates Production Incidents (Part 1)
I have been working as App/Infra Solution Architect with Microsoft from 5 years. Helping diverse set of customers across vertical i.e. BFSI, ITES, Digital Native in their journey towards cloud
Introduction
It usually starts the same way.An application goes down. Users report errors. A alert gets fired. Someone opens the Azure portal, someone else starts checking logs, and within minutes the team is juggling dashboards, alerts, traces, deployment history, configuration settings, and GitHub commits — all while pressure keeps rising.
At first glance, modern cloud-native systems look highly observable. We have Azure Monitor, Application Insights, Datadog, Prometheus, New Relic, distributed tracing, metrics, logs, alerts, and dashboards everywhere. But when a real incident happens, most teams still fall back to the same manual process: hunt for symptoms, jump across tools, form a hypothesis, test it, repeat.
That approach breaks down quickly in environments built on microservices, containers, App Services, multiple data sources, and 24/7 uptime expectations. The problem isn’t that we lack telemetry. The problem is that humans still have to correlate everything fast enough to reduce customer impact.
Not as a chatbot.
Not as “AI for the sake of AI.”
But as an operational teammate that can reason through incidents, use prior knowledge, investigate across telemetry and code, and help engineers move from symptoms to root cause much faster.
In this post, I’ll walk through two practical scenarios from my lab environment:
A .NET application outage returning HTTP 503 errors
Autonomous handling of a high response latency time alert
The interesting part isn’t that the agent can read logs. Plenty of tools can do that.
The interesting part is how the agent combines telemetry, knowledge files, runtime configuration, and engineering workflows into a single investigation loop.
Why SRE Agent?
Over the years, one pattern has shown up again and again: adding more dashboards and more alerts does not automatically improve reliability. In many organizations, it does the opposite. It creates more noise, more fatigue, and more context switching.
Most incidents are not caused by a single obvious failure. They’re caused by a chain of small things:
a config drift no one noticed,
a deployment mismatch,
an auth change,
a missing secret,
a misleading health signal,
known issue that exists somewhere in a runbook nobody has time to read during an outage.
This is where an SRE agent becomes interesting.Instead of only surfacing symptoms, it can:
gather context from prior operational knowledge,
inspect metrics, logs, and platform state,
correlate signals across layers,
check code and repository history,
propose or apply remediation,
and keep the human engineer in control for sensitive actions.
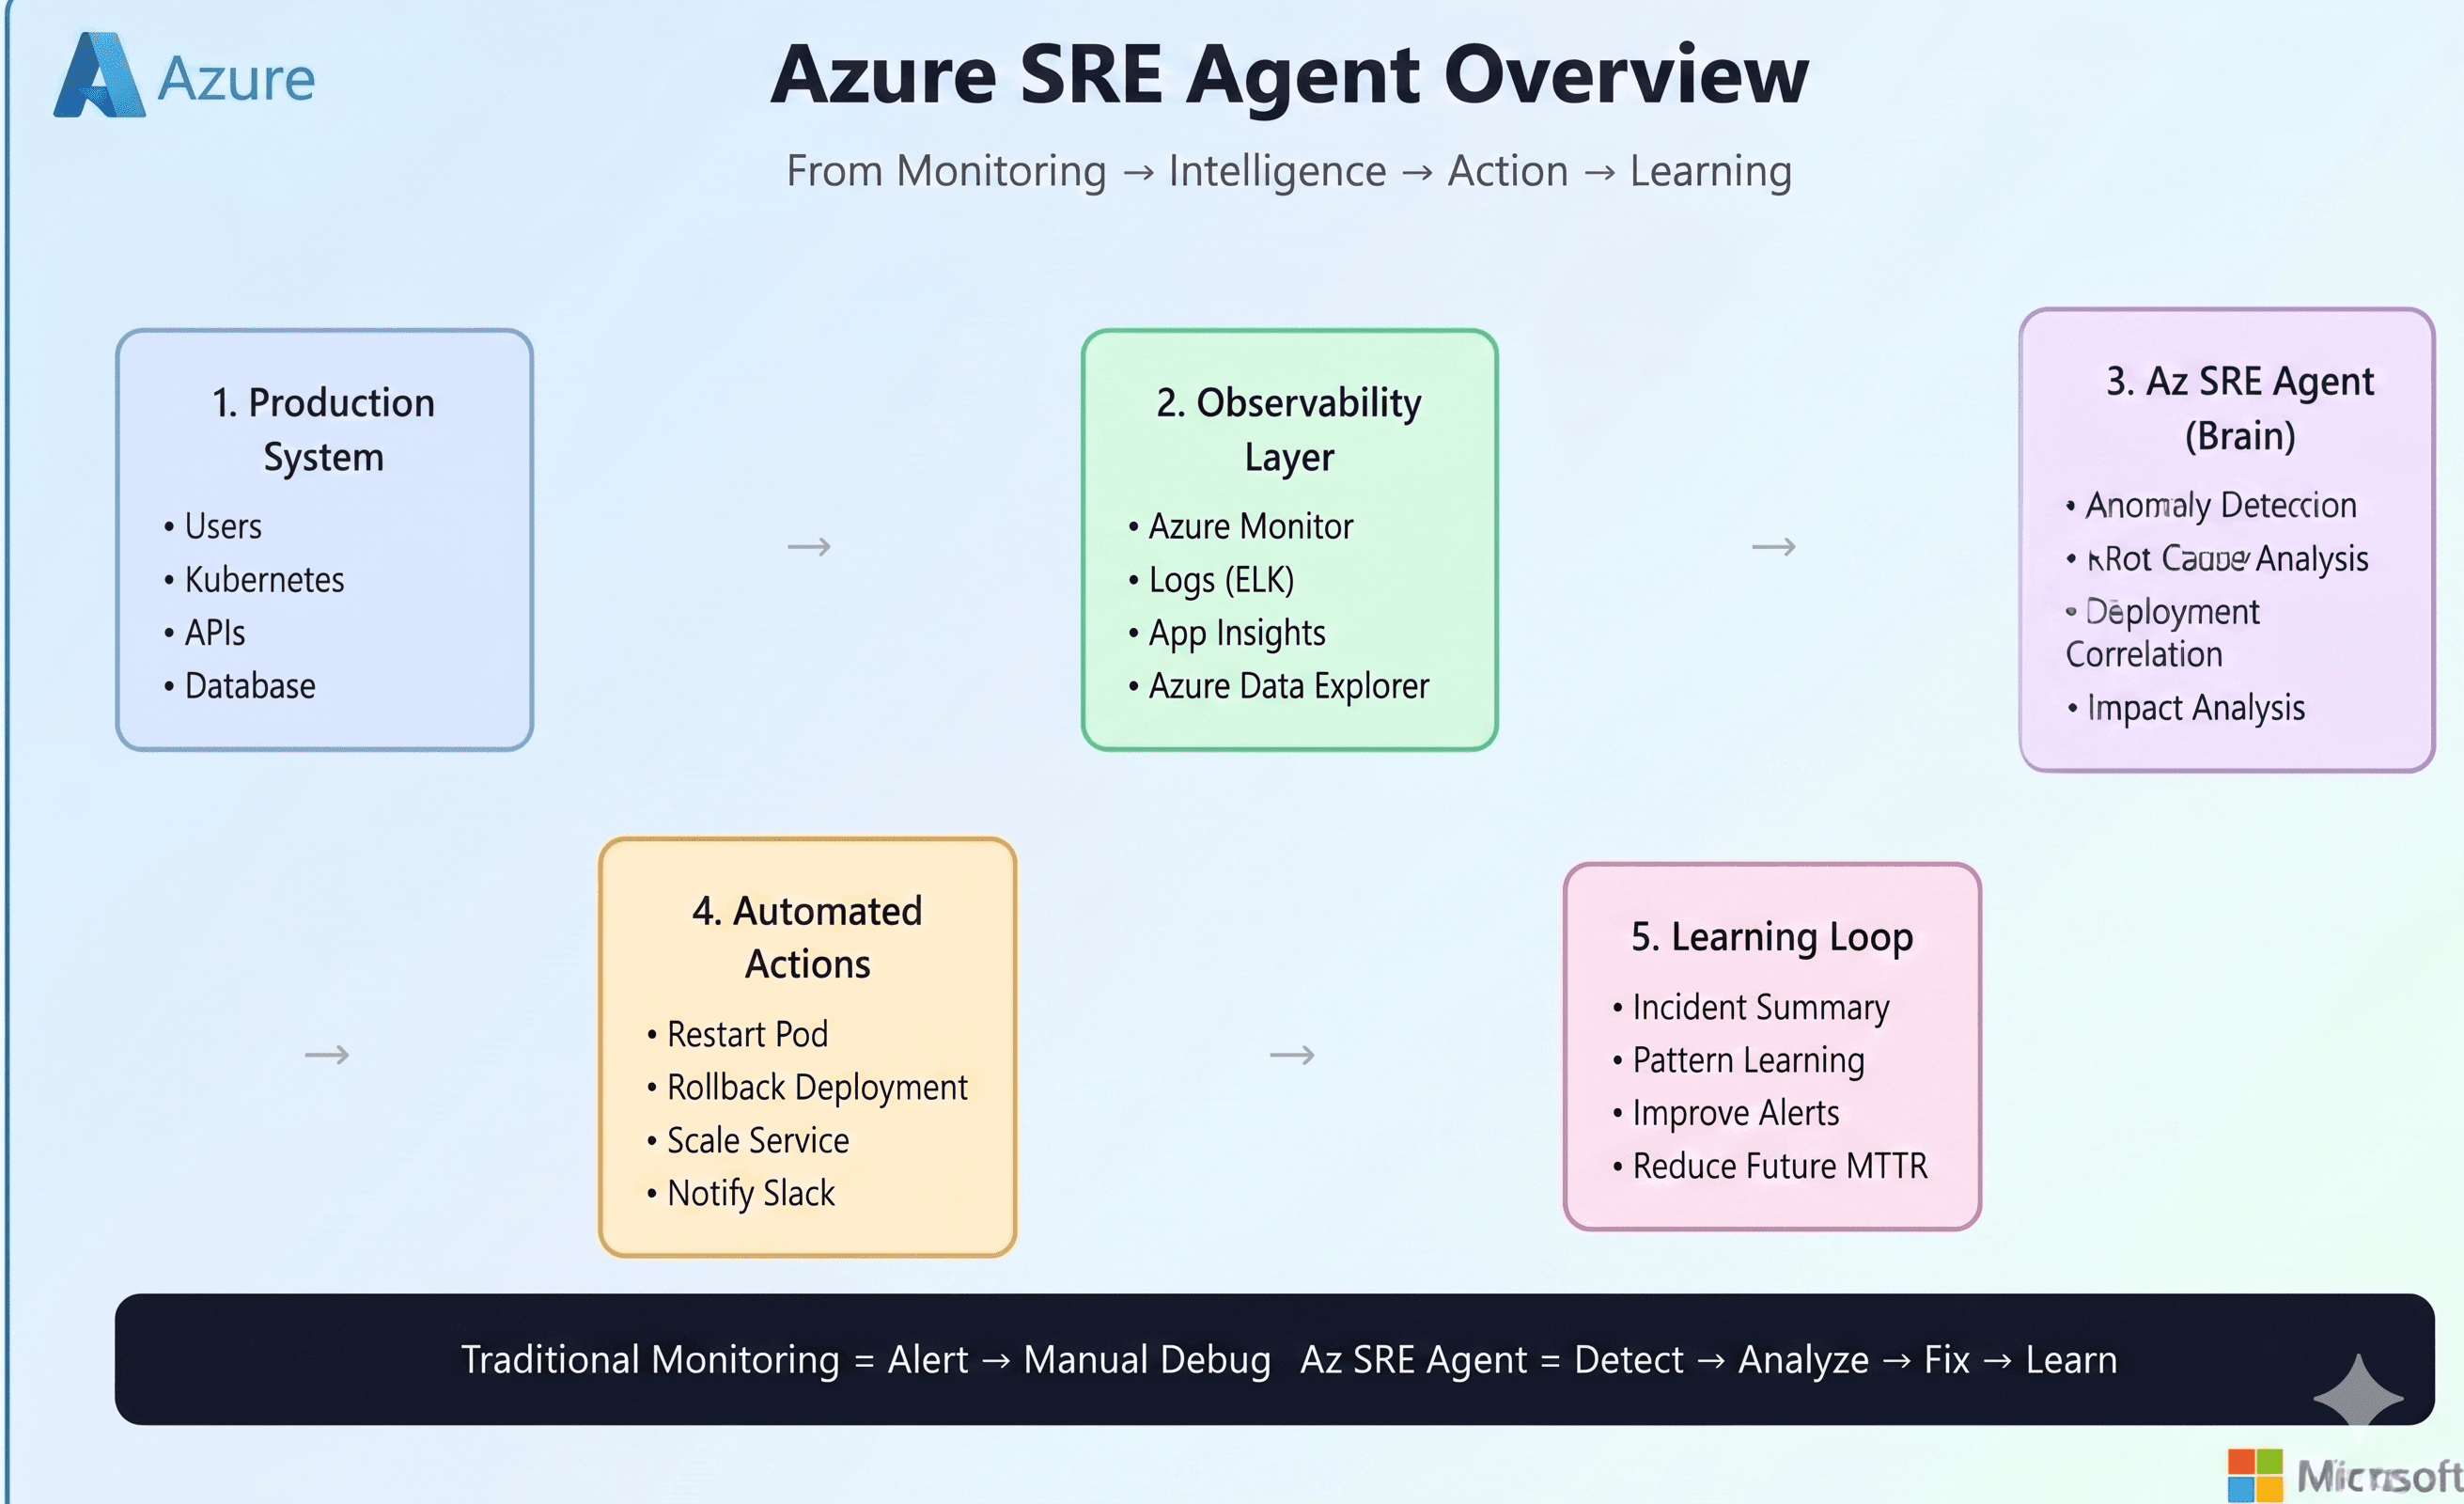
In other words, it doesn’t just help you observe a problem. It helps you investigate it.
This is Part 1 of a 2-part series
Part 1: What Azure SRE Agent can do — real incident investigation and resolution workflows
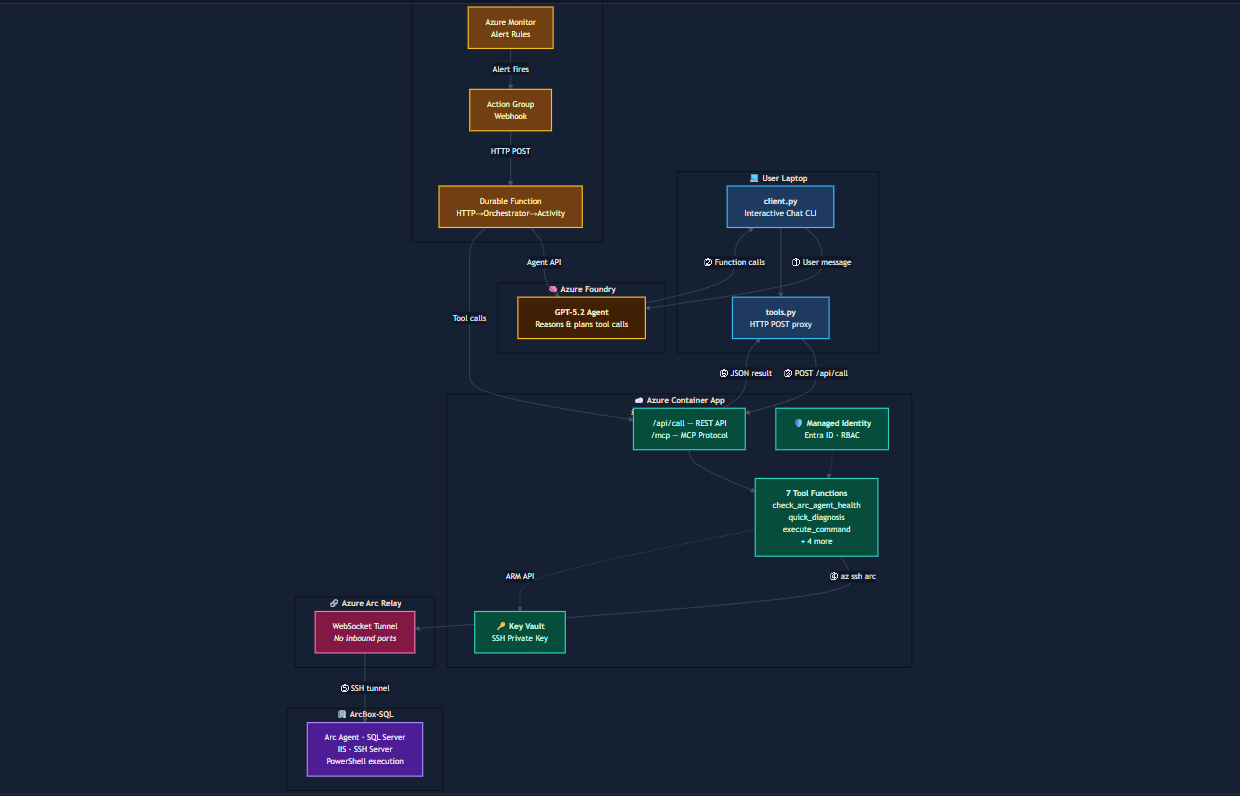
Part 2: How it works — architecture, configuration, tools, memory, permissions, and implementation details
Real world Incident Scenarios:
Scenario 1: Application Not Accesible with HTTP 503 error
The first scenario starts with a very common but frustrating production symptom: the application is down, but the platform looks fine.
I had a .NET application running on Azure App Service, backed by Azure SQL. When I opened the site, instead of the application UI, I was greeted with a generic application error page.

At this point, nothing about the error was especially helpful. It told me the app was broken, but not why.
So I did what most engineers do first: I checked the Azure portal.

The initial signal was misleading. App Service was running. The database was running. Basic resource health didn’t immediately scream “critical platform issue.” There were HTTP 5xx errors visible in monitoring, but CPU and memory were not showing the kind of dramatic spike you’d normally expect during a major failure.
This is exactly the kind of situation where manual incident response starts to drag:
the platform is “up,”
the app is effectively down,
the dashboards are incomplete,
and the root cause is hiding somewhere between runtime, config, and code.
So instead of manually hopping across five different tools, I asked the Azure SRE Agent to investigate:
“My dotnet application is not working, I see application error on webpage, can you investigate and find out why is that?”

What happened next is what made the experience feel different from traditional monitoring.
The agent did not begin with blind trial and error. It first pulled in context from its knowledge files , specifically files like debugging.md and deployment.md. That’s important, because real incident response is rarely just about live telemetry. It also depends on what the team already knows about the service.
In my setup, the agent’s operational memory is not stored as a messy chronological log. It is organized semantically by topic.

That structure matters. Instead of searching through one giant document, the agent can jump directly into focused knowledge areas such as:
service overview,
team and ownership,
architecture,
logs and queries,
deployment details,
auth behavior,
debugging patterns,
and known issue references.
That gives the agent something most dashboards do not: historical operational context.
In this case, the knowledge files already referenced a known recurring issue around SQL authentication. So the agent used that as a working hypothesis , but importantly, it didn’t stop there. It still moved on to validate the application’s real-time state through telemetry and platform inspection.
The agent checked:
App Service health and metrics,
container/runtime configuration,
logs,
startup behavior,
and application exceptions.
It noticed that CPU and memory were not showing meaningful activity, which suggested something deeper than a normal runtime load problem. It also recognized that the container might not actually be starting correctly.
Because I had configured the agent in review mode, it did not make changes silently. When it needed to access or modify configuration, it explicitly asked for approval.

That review model is a big part of what makes this usable in real enterprise environments. The value is not “uncontrolled automation.” The value is fast investigation with human guardrails.
Once approved, the agent started walking through App Service configuration, logs, and runtime settings.

The first clear issue it found was not in the application code at all — it was in the hosting configuration.
The container image exposed port 8080, but the App Service configuration was missing the required WEBSITES_PORT setting. Even if the app code and database auth had been correct, App Service would still not have routed traffic properly to the container.
At the same time, the agent also confirmed the earlier knowledge-based suspicion: the application was using SQL authentication, while the SQL server was configured in a way that conflicted with that access pattern.

This is where the investigation started to become more powerful than a typical dashboard workflow.
A human engineer under pressure might fix the first visible issue and move on. But the agent continued reasoning through the dependency chain:
one issue in container routing,
another in database authentication,
and likely more hidden misconfigurations behind them.
It applied the first round of fixes and re-validated the service.
But the application was still returning HTTP 503.
That’s the point where many incident bridges get stuck one fix has been applied, the expectation is recovery, and when recovery doesn’t happen, the whole investigation needs to widen again.
The agent did exactly that.It went back into the App Service configuration and noticed something subtle but critical: the DOCKER_REGISTRY_SERVER_PASSWORD setting was effectively empty. That meant the container could not pull its image from Azure Container Registry correctly.

Now the picture was clear. This outage was not caused by one dramatic failure. It was caused by multiple compounding misconfigurations:
Missing container port configuration (
WEBSITES_PORT)SQL authentication mismatch
Missing container registry credentials
And, as the final investigation summary confirmed, a connectivity issue related to SQL access configuration as well
After applying the necessary fixes, the agent validated the service again.
This time, the results were exactly what you want to see during an incident: the application recovered, the endpoints returned HTTP 200, and the UI became available again.


What I liked most about this scenario is that the agent did not behave like a scripted “runbook bot.” It behaved more like a junior-but-fast SRE partner:
it started from known issues,
validated live telemetry,
checked config,
correlated runtime behavior,
asked for approval before making changes,
and kept investigating even after the first fix did not fully resolve the incident.
The final recommendation was also the right long-term one:
instead of relying on fragile SQL credentials, move the application toward Managed Identity / Entra-based authentication to reduce future failures.
That is what a good SRE workflow should do: not only restore service, but also point toward a more durable operating model.
Scenario 2: Autonomous Handling of Incident
The first scenario showed guided investigation in review mode.
The second scenario shows what happens when the agent is connected to an incident platform and can begin working automatically from an alert.
This time, the trigger was not a user-facing outage page. It was a Sev2 Azure Monitor alert for high response time.

The alert indicated that requests were averaging over 5 seconds. That kind of alert is common — and often noisy. Sometimes it points to a real production issue. Sometimes it reflects a spike, a bad test path, or a monitoring rule that needs more context.
What matters is how quickly the investigation can distinguish between those possibilities.
As soon as the alert was detected, the SRE Agent acknowledged it and created an investigation plan.

This part is important.
Instead of immediately jumping to one likely cause, the agent laid out a structured plan:
gather knowledge from memory files,
search past incidents,
inspect the currently affected app,
correlate recent changes,
and then mitigate.
That sequencing mirrors how a strong human SRE would approach the issue — but the agent can do it in parallel and without fatigue.
During investigation, it pulled from prior knowledge, reviewed logs, and correlated the alert with application behavior. It discovered that the high response time was not simply a generic infrastructure slowdown. A key part of the latency was being driven by chaos/testing endpoints being hit and by application behavior that still needed code fixes.
The agent did something particularly valuable here: it connected the incident to the engineering workflow, not just to the monitoring workflow.
It created a GitHub issue summarizing the incident, identifying the root cause, and documenting the remediation path.

That issue became more than an alert record. It became an engineering artifact:
what happened,
what caused it,
what had already been investigated,
and what change was needed next.
The agent then moved toward code-level remediation:
it identified the needed changes,
prepared a fix branch / PR flow,
and connected the operational incident to the software delivery pipeline.
The remediation path included both monitoring-side correction and application-side correction:
refining the alert rule logic so chaos endpoints did not distort signal quality,
and updating application behavior to reduce timeout-related failure patterns.

What makes this scenario compelling is that the agent did not stop at “I found the problem.” It helped push the process all the way toward:
alert understanding,
signal cleanup,
code fix identification,
deployment workflow,
and verification.
That is a very different experience from the traditional pattern where one tool raises the alert, another tool shows logs, a third tool tracks the issue, and a fourth system eventually gets the fix.
Here, the incident workflow becomes much more continuous.

What Scenario 2 Demonstrates
If Scenario 1 was about guided troubleshooting, Scenario 2 is about something broader: operational orchestration.
The agent is not just a log reader. It becomes a bridge between:
observability,
incident handling,
historical context,
GitHub engineering workflows,
and remediation execution.
That’s where the SRE model starts to evolve.
Instead of engineers spending most of their time gathering context, the agent does the context gathering first. The human engineer can then focus on:
approving sensitive changes,
validating business impact,
reviewing code changes,
and making the final operational judgment.
That shift matters because the biggest cost in many incidents is not only the outage itself — it is the time lost assembling the investigation.
Why THIS Matters
There’s a lot of hype right now around AI in operations. Some of it is useful. A lot of it is vague. That’s why I prefer to evaluate these systems through practical incident scenarios.
For me, the interesting question is not:
“Can AI read logs?”
The interesting question is:
“Can an agent meaningfully reduce investigation time, correlate across layers, and safely help engineers move toward resolution?”
From these scenarios, the answer looks increasingly like yes , with the right guardrails.
What stood out to me most was not raw automation. It was the combination of:
memory (knowledge files and past learnings),
reasoning (moving beyond one-signal diagnosis),
workflow integration (Azure resources + GitHub),
and human control (approval gates for risky actions).
That combination is what takes an SRE agent beyond a fancy assistant and makes it operationally relevant.
Conclusion
Traditional monitoring stacks are very good at telling us something is wrong.
What they usually do not do well is help us answer, quickly and reliably:
What exactly failed?
What changed?
Is this a known issue?
Is it platform, config, code, auth, or deployment?
What is the safest next action?
And how do we prevent this from happening again?
That is the gap Azure SRE Agent begins to fill.
In the first scenario, it helped trace a 503 outage across telemetry, memory, config, registry credentials, and SQL access issues.
In the second, it moved from alert detection into structured incident investigation and GitHub-driven remediation.